

google data studio turns your data into fully informative reports with dashboard that is easy to measure, understand, read ans share. unlock the power of your data with interactive reporting formats which inspire smat business decisions in 2024.
what is google data studio/Looker studio
we’ve all heard he saying ‘a picture is worth a thousand words‘. but a complete report of your marketing data can be much more than a picture. google looker studio previously known as google data studio which is a free online data visualization tool for customizable reporting with dashboard. data visualization is very important for your internal reporting as its provides you faster learning progress with smart decision making. by using gds/gls you can reduce the time and increase the productivity of your team.
Best Practices for Using Google Data Studio
- Start with a Clear Objective: Before creating your report, define what you want to achieve. Are you looking to track website performance, monitor ad campaigns, or analyze sales data? A clear objective will guide your report design and ensure that it meets your needs.
- Keep It Simple: While it’s tempting to include every possible data point, try to keep your reports focused on the most important metrics. Overloading your report with too much information can make it difficult to interpret.
- Use Filters and Controls: Filters and controls allow users to interact with the data and view it from different perspectives. For example, you can add date range controls to allow users to see data from different time periods.
- Regularly Update Your Reports: Ensure your reports are always up-to-date by connecting them to live data sources. This way, you can avoid the hassle of manually updating your reports.
- Leverage Community Templates: If you’re new to GDS or need some inspiration, explore the template gallery. You can find a variety of community-created templates that can save you time and give you new ideas for your reports.
why use looker studio/ data studio?
- data visualization
- efficient reporting
- reduce time
- attractive graphics
- automated working
- live dashboard
- leverage Teamwork’s
- various data connectors
- data transformation
- customizable insights
- pre built templates
- user friendly
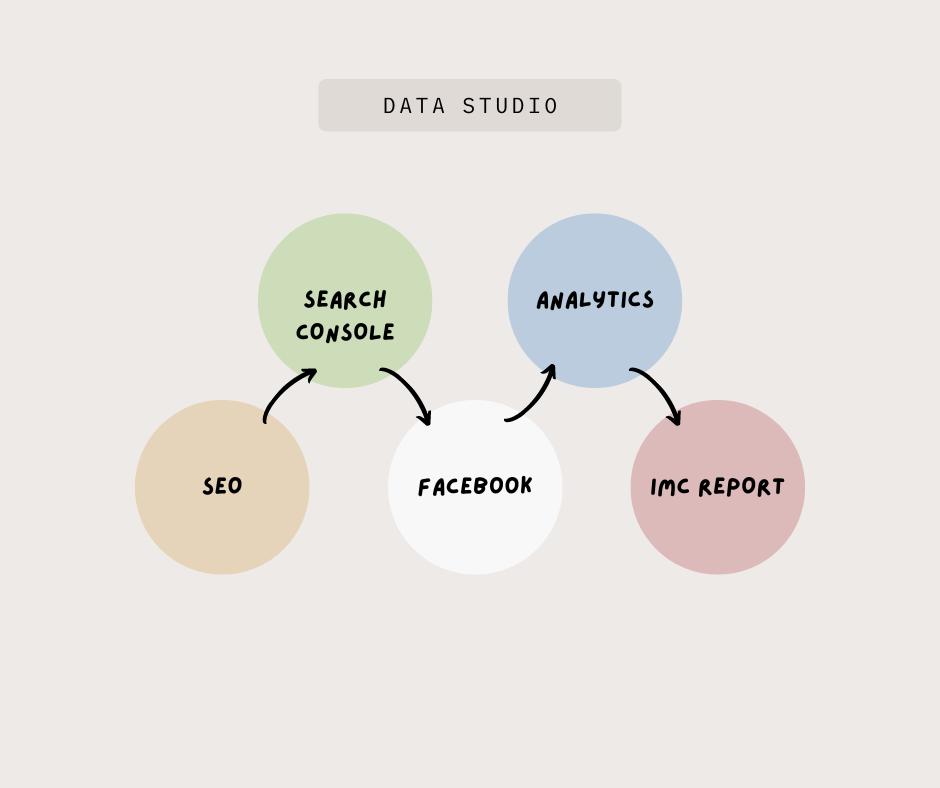
what types of report you can make in google looker studio?
we can make multiple Reporting with google data studio. like:
- seo report
- facebook ads report
- google ads report
- youtube report
- analytics report
- search console report
- integrated ppc report
- overall marketing report
- complete digital marketing report
how to create and set up google data studio or looker studio
search https://lookerstudio.google.com/ in google. you can log in with your google account easily. in home interface you will find
- report section
- data sources section
- Explorer section
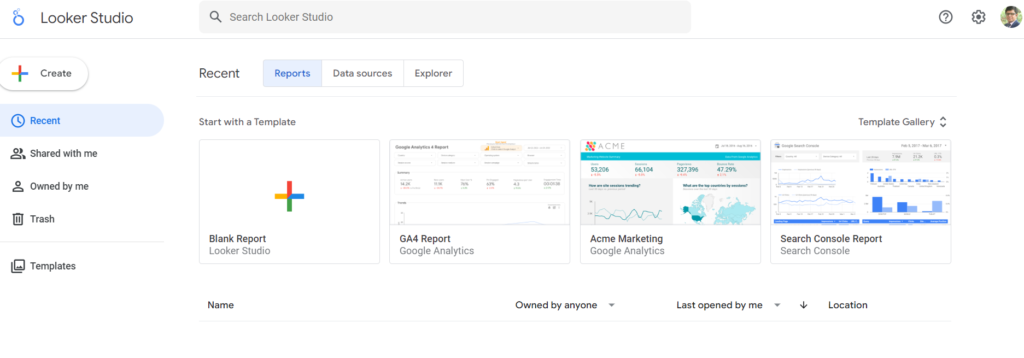
you can make reports with pre built templates in google looker studio. if you wants to connect your data sources then you can do that from data sources. we will discuss these in details.
1. reporting with built in templates
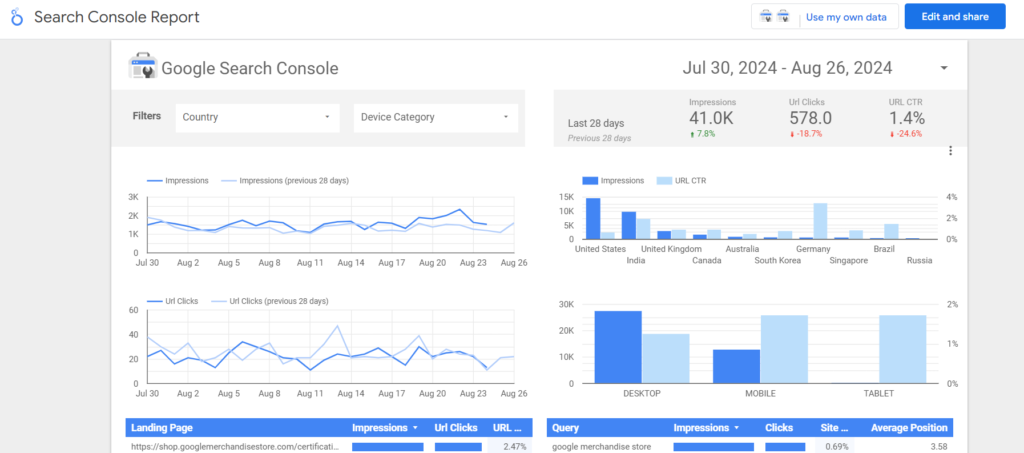
you can make reports with pre built templates like ga4 or search console templates or you can create a report from scratch. here we are creating a report from a pre built template for your better understanding.
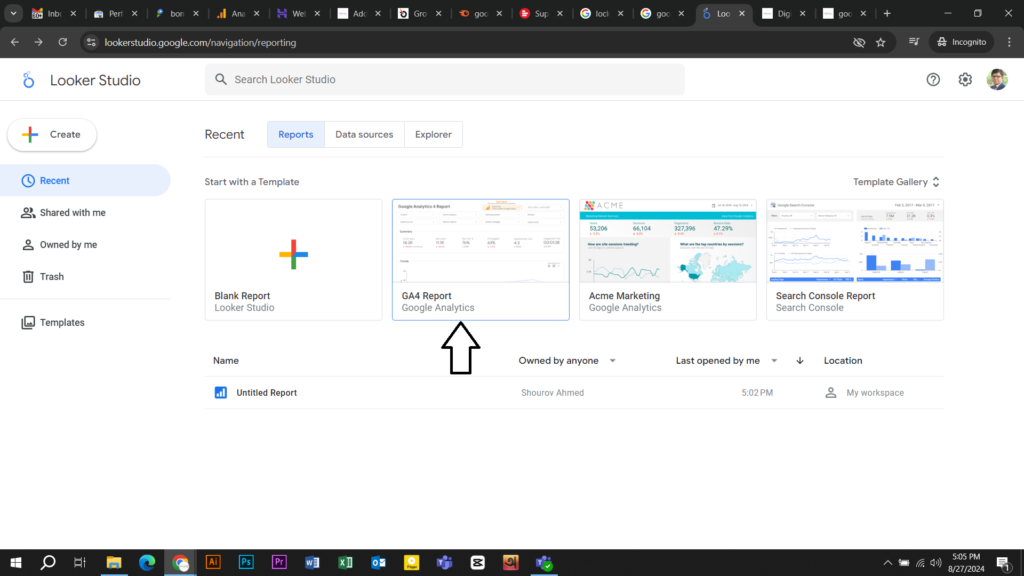
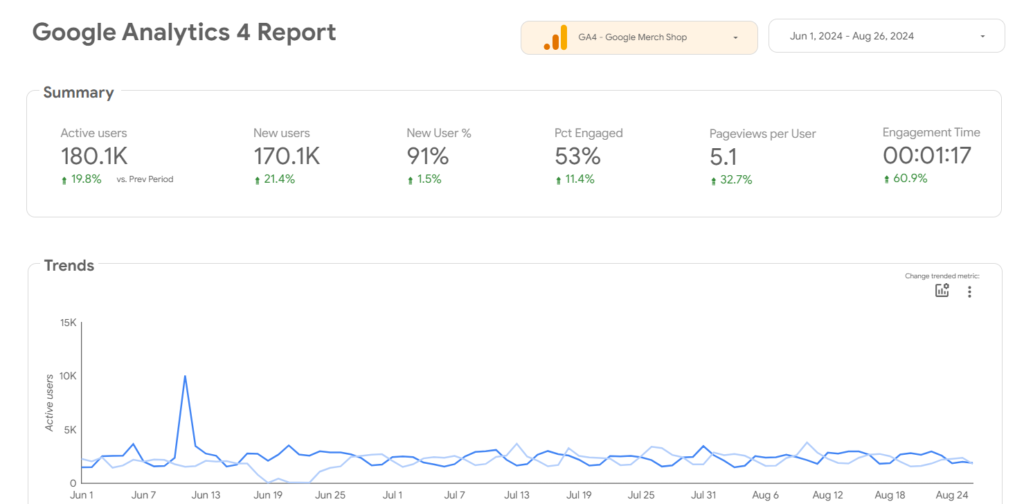
click on ga4 report from your dashboard to create a google analytics report for your company.
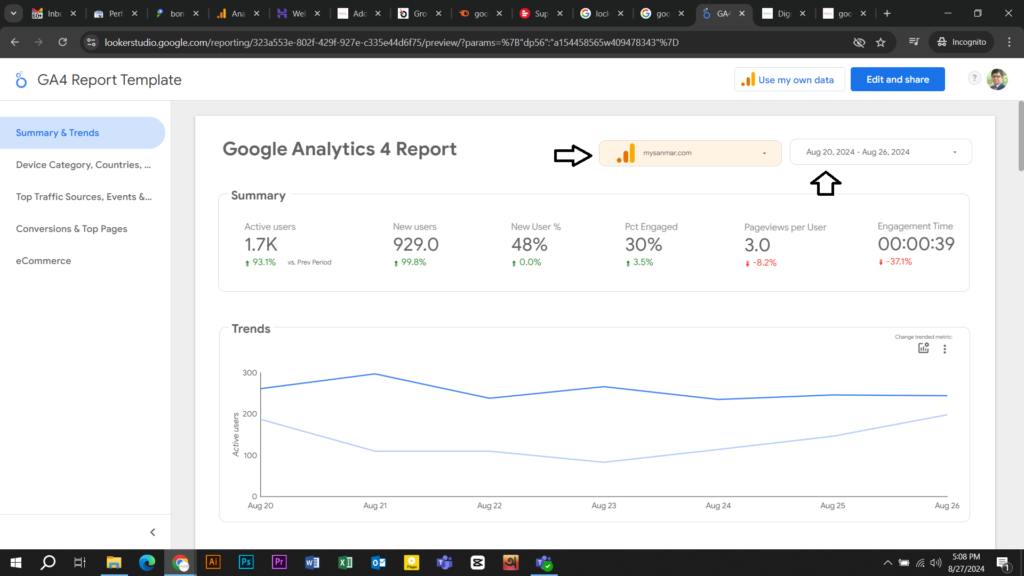
from the reporting section you can choose your ga4 properties from the drop down, you can also select the date range from the date section.
in summary & trend section you can find:
- active user
- new user
- new user %
- engaged audience %
- page views per user
- engagement time
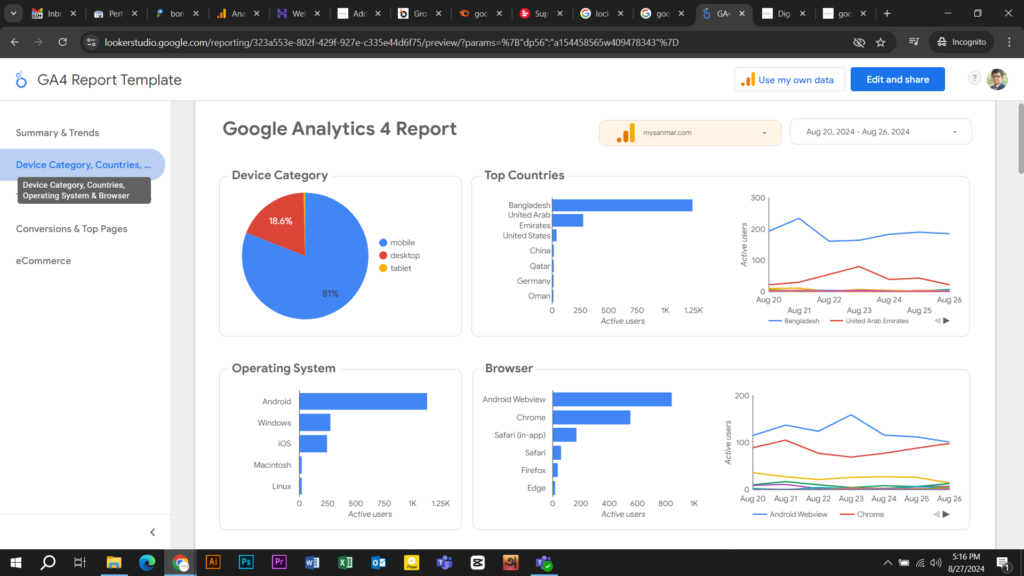
from device category section from the left side you will find:
- device country
- top country
- operating system
- browser
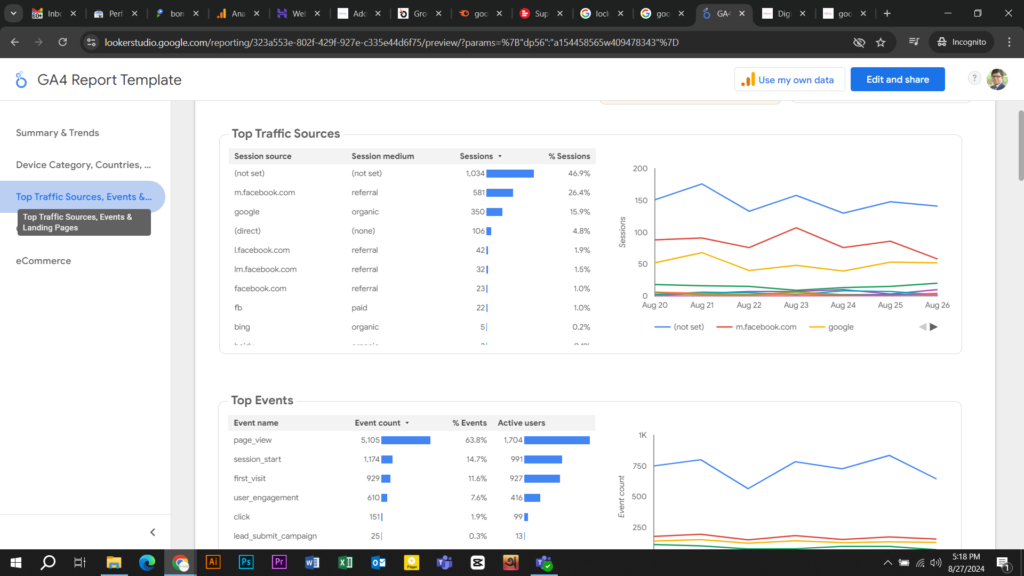
from top traffic sources and events section you will gather data of your traffic or events that you have set of ga4
- top traffic source
- top events
- top landing page data
if you created your conversion list then you will see the data in ga4 report in data studio.
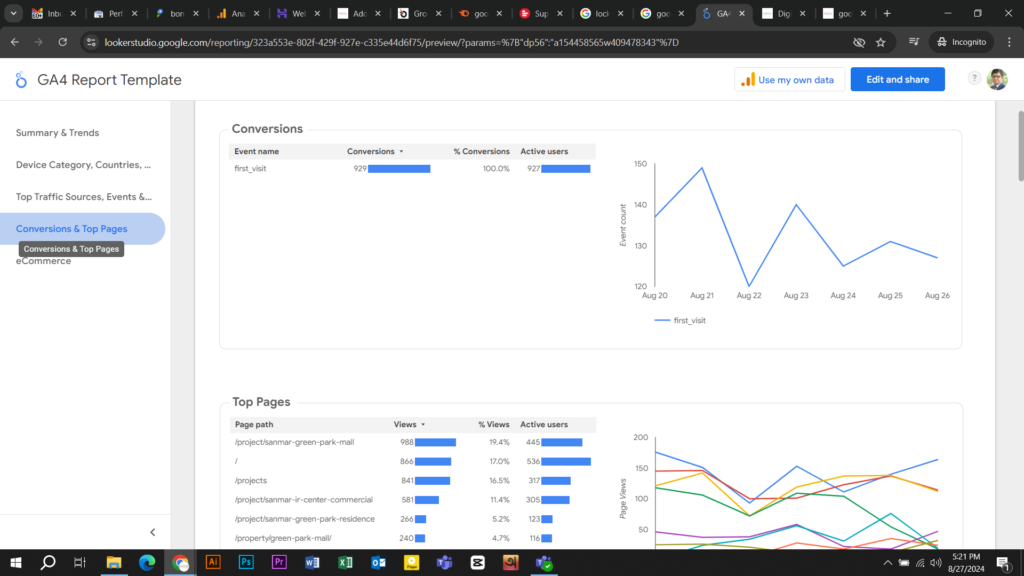
if you have a e commerce website then we can have the insights of your e commerce website data in google looker studio reporting section.
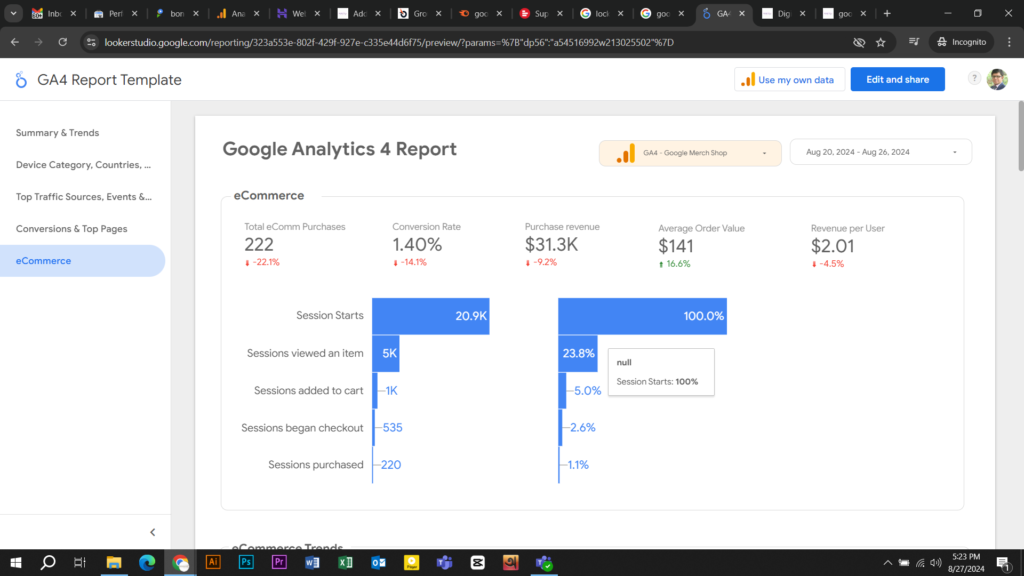
that is why you can create a default report with google looker studio.
2. reporting with data sources
In Looker Studio (formerly known as Google Data Studio), data sources are the connections to the various places where your data is stored.
These data sources allow you to pull data into Looker Studio so you can create reports and dashboards.
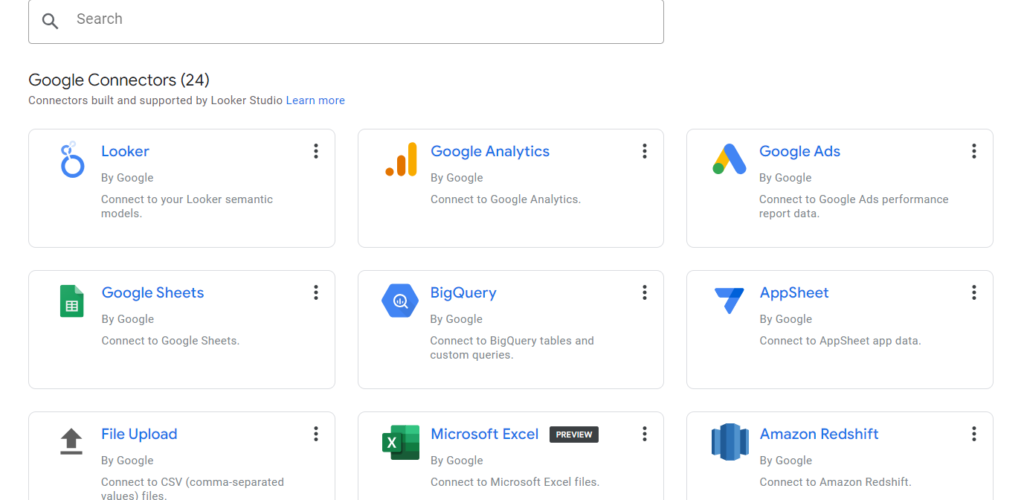
- google connectors
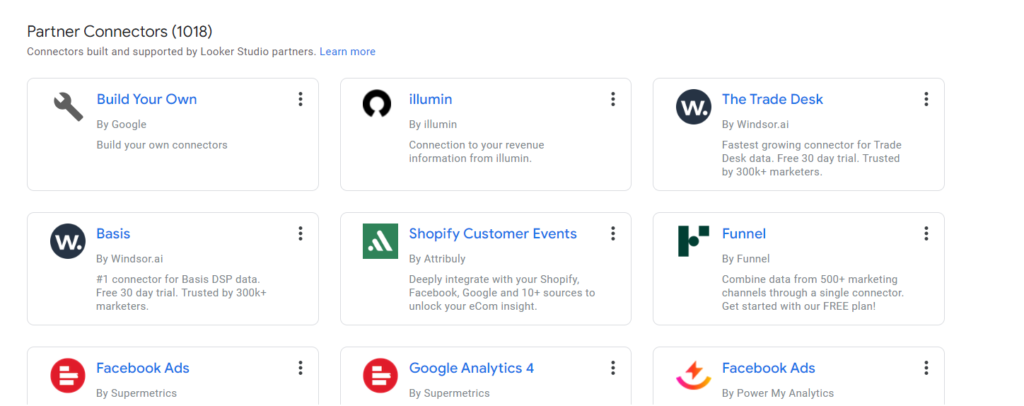
- partner connectors
Here’s a breakdown of what data sources are and how they work:
- Types of Data Sources:
- Google Services: This includes Google Analytics, Google Sheets, Google Ads, and BigQuery.
- Database Connectors: These are connections to SQL databases like MySQL, PostgreSQL, or SQL Server.
- Third-Party Services: Integrations with services like Facebook Ads, HubSpot, or Salesforce.
- CSV and Excel Files: You can upload files directly from your computer.
- Custom Connectors: You can use custom connectors to connect to data sources that are not natively supported.
- Connecting a Data Source:
- Create a Data Source: In Looker Studio, you start by creating a new data source. You choose the type of data source you want to connect to and authenticate if necessary.
- Configure the Connection: Depending on the type of data source, you might need to provide connection details, such as API keys, credentials, or database connection strings.
- Select Data: Once connected, you choose which data tables or fields you want to use in your reports.
- Using Data Sources in Reports:
- Adding to Reports: After creating a data source, you can add it to your reports. This allows you to use the data in charts, tables, and other visualizations.
- Data Blending: You can blend data from multiple sources within a single report to create comprehensive analyses.
- Data Controls: Use data controls like filters and date ranges to enable dynamic interaction with your data.
- Data Management:
- Data Refresh: Many data sources support automatic data refreshing, so your reports stay up-to-date with the latest information.
- Data Fields: You can create calculated fields, apply filters, and modify data schemas within Looker Studio to tailor your data to your needs.
Essentially, data sources in Looker Studio are the foundational elements that allow you to visualize and analyze your data effectively.
Conclusion
Google Data Studio is an essential tool for anyone looking to make data-driven decisions. Its ability to turn raw data into interactive and insightful reports makes it invaluable for businesses of all sizes. Whether you’re a marketer, analyst, or business owner, mastering GDS can help you unlock the full potential of your data. So why wait? Start creating your first report today and see how Google Data Studio can transform the way you view your data.